We keep pushing the needle forward for you here at MyBizMailer.
And this week we released a new version of our Campaigns Reporting page.
There's lots of cool new things like:
* More visual impact
* Simpler data display
* Clearer open and click graphing
* Visual click mapping
* Subscriber device information
More Visual Impact & Simpler Data Display
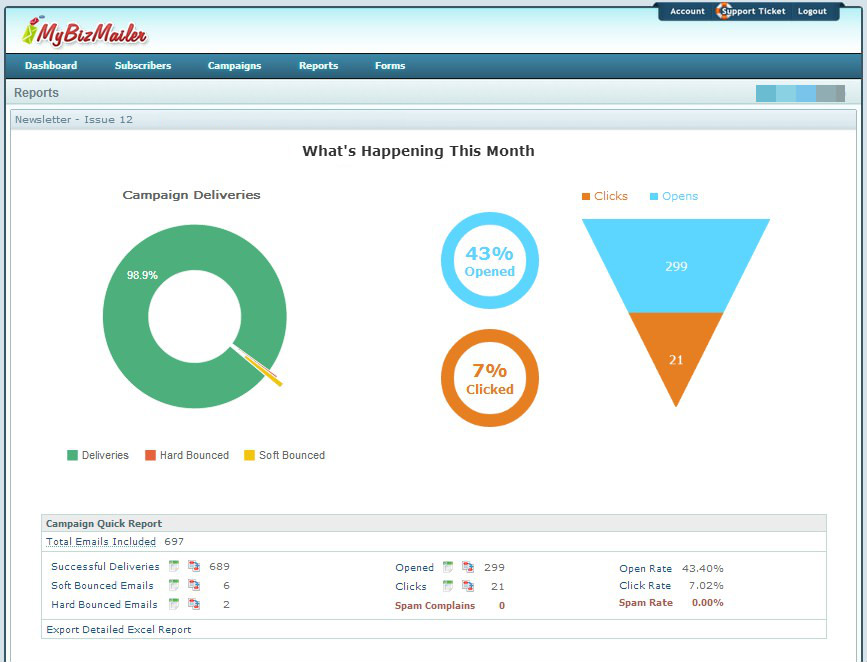
We wanted to give you a visually impactful way to quickly see the information that you're looking for.
And now that wish has become a reality.
The minute that you open your Campaign Reports you'll discover immediately some of the most key and relevant information displayed to you.
Campaign deliveries, open and clicks have been presented in such a way that you can't miss what you're looking for.
Clearer Open and Click Graphing
We redisgned the Open & Click graphing as well.
Now you can simply see what has been going on with your campaign.
Hover over one of the key markers on the graph and you're presented with even more detailed information.

Visual Click Mapping
We also released version 1.0 of our Visual Click Mapping. Where we show you your email campaign and give you the click percentages of the links that you've included inside.
Subscriber Device Information
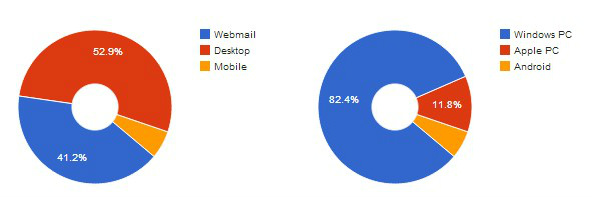
Want to know what are the most popular ways that your subscribers are viewing your email campaigns?
Well now you can quickly and easily discover that for yourself.
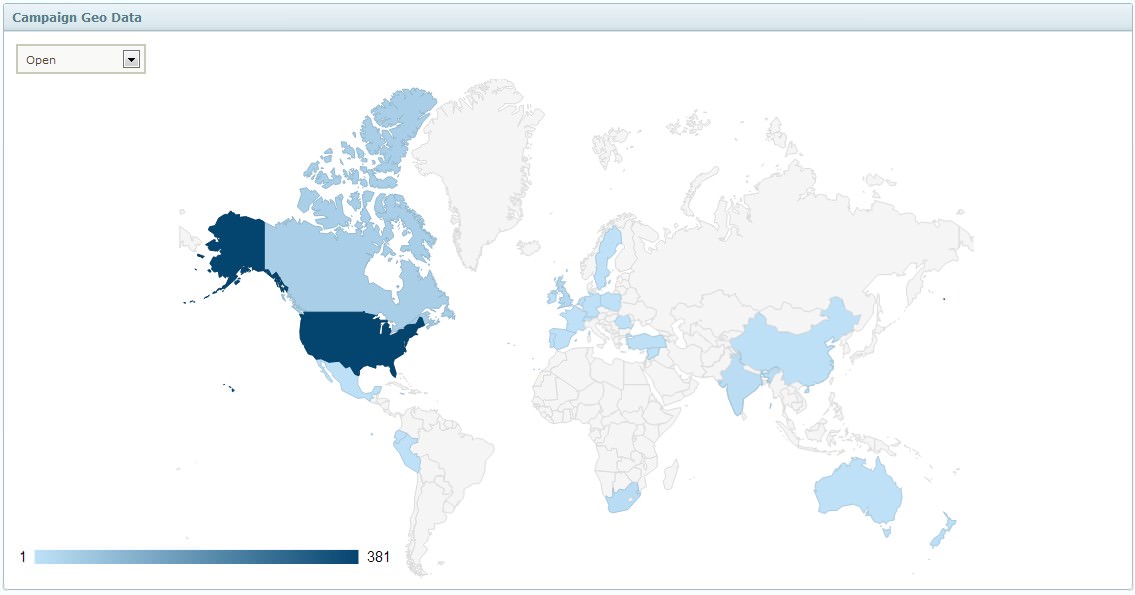
Open and Click Geo Data
Ever wondered what part of the world your open and clicks are coming from?
Boom! Here you go.
Let us know what you think
As always, if you have any questions or suggestions please send us a message by clicking here.
The MyBizMailer Team